
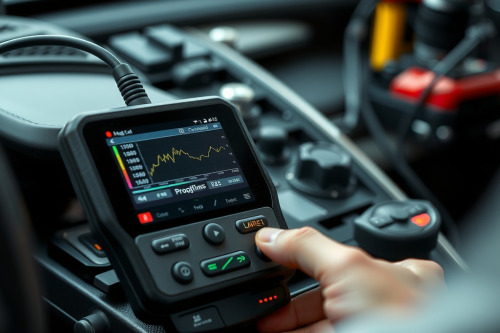
After twenty years of busting knuckles in a busy independent shop, I can tell you that reading fault codes alone will leave you chasing ghosts and wasting valuable bay time. Mastering real-time diagnostics through accurate OBD2 Scanner live data analysis is the only way to catch intermittent misfires and pinpoint sneaky vacuum leaks before throwing expensive parts at a customer vehicle. Connecting a solid diagnostic tool to the DLC gives us an unvarnished window directly into ECM sensor outputs and fuel trim adjustments while the engine is running. Let's walk through how to interpret these real-time PID streams so you can prevent costly comebacks and boost shop efficiency today.

Understanding fuel trim data with your OBD2 Scanner live data analysis
Every flat-rate tech knows that DTC codes only point you toward a system, not the actual root cause. When you tap into parameter IDs, fuel trims tell the real story of engine health. Short-term fuel trim adjusts instantaneously to changing oxygen sensor inputs, while long-term fuel trim reflects cumulative learned corrections over time.
Deciphering short-term and long-term fuel adjustments
If you see short-term fuel trim hovering at positive fifteen percent at idle, the computer is dumping extra fuel to compensate for unmetered air. Rev the engine to twenty-five hundred RPM while watching your rolling cart screen. If those fuel trim numbers drop back toward zero, you're dealing with a vacuum leak rather than a failing fuel pump or clogged injectors.
How to read oxygen sensor waveform streams in real time
Glancing at numeric values alone can hide rapid signal dropouts that trigger false codes. Graphing sensor voltage output gives you an accurate visual trace of air-fuel switches. Upstream zirconia oxygen sensors should oscillate rapidly between zero point one and zero point nine volts several times per second at operating temperature.
Upstream vs downstream sensor behavior under load
Downstream oxygen sensors ought to display a relatively steady voltage line around zero point forty-five volts under stable cruising conditions. A downstream signal mirroring the upstream sensor indicates a dead catalytic converter. Watching these waveforms live prevents you from replacing good sensors when the underlying converter efficiency has degraded.
Real workshop troubleshooting: chasing an intermittent Ford misfire
Just last Tuesday, I had a stubborn Ford F-150 in my bay with an intermittent misfire that left no pending code in the ECM. I grabbed my diagnostic tablet, squeezed under the heavy dash, and snapped the Bluetooth VCI dongle into the stubborn DLC connector. The rubberized casing felt comfortable in my hand as the bright screen remained completely legible under our harsh shop fluorescent lights.
Instead of guessing and swapping ignition coils across cylinders, I set up custom PID monitoring for individual cylinder misfire counts alongside mass air flow readings. While power-braking the truck in the bay, cylinder four registered thirty misfires within ten seconds while MAF rate remained perfectly stable. Pulling the boot revealed carbon tracking along the spark plug porcelain, proving a physical arc short rather than a fuel delivery problem.
Graphing multiple PIDs for Advanced OBD2 Scanner live data analysis
Modern vehicle networks flood diagnostic tools with dozens of live data feeds simultaneously. Overlaying related parameters on a single graph grid reveals dynamic sensor interaction. Combining engine speed, throttle position, and intake manifold pressure allows you to verify real-time sensor response without taking your eyes off the drive grid.
Correlating MAF readings with throttle position
When you snap the throttle wide open, mass air flow sensor grams per second should instantly spike in direct alignment with throttle position percentage. A delayed rise in MAF output points directly to a contaminated hot wire inside the sensor housing. Clean the wire with dedicated aerosol spray or replace the assembly to restore proper engine performance instantly.
Common scanner hardware limitations and diagnostic pitfalls
Not every scan tool processes live parameter streams at the same refresh rate. Lower quality handheld units slow down dramatically when graphing more than four PIDs at once, causing missed signal drops. Wireless VCI dongles can also lose connection around high-voltage ignition systems or shop microwave interference.
You must also recognize when an ECM uses calculated substitute values during sensor failure modes. If a coolant temperature sensor fails, the engine computer might display a generic default value of one hundred eighty degrees Fahrenheit. Always verify live sensor readings against physical multimeter tests or infrared thermometer sweeps to avoid falling down a diagnostic rabbit hole.
Practical advice for implementing live data diagnostics in your bay
To master OBD2 Scanner live data analysis in daily bay operations, establish baseline reference graphs from known good vehicles during routine service. Save these diagnostic snapshots to your shop management network for quick reference when troubleshooting troublesome comebacks. Order updated scan tool software subscriptions annually to ensure full bidirectionality and accurate PID mapping across newer model years. Put these diagnostic techniques into practice on your next repair job, share this article with your shop technicians, and invest in high-refresh diagnostic equipment today.